Tracking Results of your Direct Mail Campaigns
Henry Ford once said “Half the money I spend on advertising is waste, and the problem is I do not know which half.” That was ‘then’. Now, there really is no excuse, regardless of which channel you are using for your marketing & advertising campaigns, not to track and attribute Return on Advertising Spend (ROAS). Even if the medium is print!
Having the ability to measure results is fundamental. If you do not have a clear plan of how to measure campaign efficacy, hit pause and give measurement due consideration. ZAP~POST does not use tracking codes or pixels and does not provide you with another conflicting and product-bias tool to measure campaign efficacy. You will already have measurement tools - this guide is intended to demonstrate the principles of measurement and how to measure efficacy, using your existing tools.
In this section, we explore multiple methods of measuring, split into two methods. To really understand the efficacy of your campaigns and the resulting Return on Advertising Spend (ROAS), it is essential to measure both methods:
Directly-Attributable Methods:
QR Codes - explained in more detail here.
You have the ability to add complex tracking links to QR codes directly in the ZAP App - our simple-to-use ‘Campaign Builder’ tool for Tracked QRs generates the tracking code. You simply enter the campaign details into each field and the App will generate a tracked URL for which any scans are reported in our Insights area. This will give you the ability to analyse an effective ‘Click Through Rate’ (CTR) and subsequent conversion rate, ultimately deriving an ROI. Remember though, this is only ONE measure. There are many more…
Unique Offer Codes
Check the section on Offer Codes to understand the various options and considerations when deciding which type of Offer Code to use. ‘Unique’ could potentially be a little ambiguous. For tracking purposes, the requirement is to use a code (whether generic or unique), that is only to be found in a Zap. In other words, if you want to measure Offer Code usage with certainty, the Code(s) should not be used in any other marketing channel. That way, whether the code was used by the intended recipient or not, you can attribute its use to your Zap Campaign.
Campaign specific landing pages
Create a custom URL which only exists in your ZAP Creative or Message for the purposes of measuring the page landings. The Custom URL, which may not be reached from the website navigation, will therefore only record visits from Zaps.
The obvious drawback is that you are reliant on recipients entering the entire URL so will not, on its own, provide you with 100% clarity.
Single purpose phone numbers
ZAP~POST can provide you with dedicated telephone numbers which automatically route to your usual customer support or sales team. Calls logs provide reporting on the count and origin of inbound calls.
Like with campaign-specific landing pages, call logs rarely capture 100% of the response but definitely contribute to the overall ROAS reporting.
Search phrases
Similar to Custom Landing pages, if you invite your recipients to visit your website and search using a particular phrase, you can report on the count of search phrases used in Google Analytics. Not a particularly robust method of measurement and cannot be relied on exclusively to determine ROAS but does work in certain circumstances.
Recommended more as a Customer Experience tactic, rather than a measurement metric.
Indirectly attributable methods:
Test & Control groups
A tried and tested method of measuring campaign efficacy and ROAS.
Importantly, both the ‘Test’ and the ‘Control’ groups must be from the same Customer segment. The split is entirely your choice - as a guide, the Test group is usually 80% to 90% of the target segment, holding back 10% - 20% of recipients, being the Control group.
Over the Campaign duration, continue to measure the activity of both groups. Clearly, you are expecting to see an uplift in your Goal metric (revenue, shares, sign-up) from the Test group, vs the Control group.
Tip: This method is relatively full-proof but it does require you to flag both Groups in your CRM / CDP to enable simple reporting.
Cohort analysis
The Champion of Champions when it comes to reporting. Both time and patience are required and your CRM / CDP tools need to be up to the task.
Measuring each segment or cohort of Customers over time, in terms of recency and frequency of engagement, will provide absolute clarity on your Campaign's performance.
Here’s what Cohort Analysis looks like: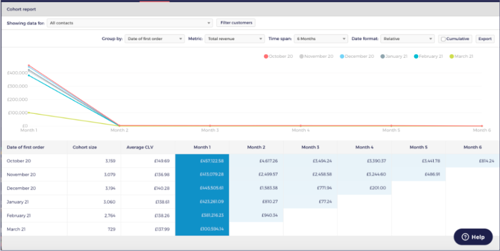
Credit: Ometria
For more detail on Cohort Analysis, lean on your ESP / CRM / CDP partner.
From Ometria.com:
“The cohort report analyses your contacts acquired by month (month of first order, lifecycle stage, etc.) and provides an overview of customer behaviour over time. The report looks at newly acquired contacts, i.e. contacts who were added to your Ometria database within your selected time period. A ‘cohort’ is a group of contacts that share a common characteristic. They are grouped based on the category you select. “
Jump to it In this article:
Recommended Reads